
OT security and industrial connectivity
IoT Air Quality Monitoring
Understand your air. Identify problems early. Improve the environment where people work.
Indoor air quality affects comfort, concentration, health, and productivity.
Our IoT Air Quality Monitoring solution gives you continuous visibility into the conditions inside your building so you can identify issues, understand patterns, and take action before they become complaints or operational problems.
The solution combines connected air quality sensors, secure data transmission, dashboards, alerts, reporting, and optional support into one complete service.
Continuous monitoring. Clear insights. Practical actions.
Why it matters
Why monitor indoor air quality?
Problems with indoor air are often invisible until people start noticing symptoms or raising complaints.
Poor ventilation, elevated CO₂, particulate matter, VOCs, temperature, humidity, or other pollutants can develop gradually and vary significantly throughout the day.
Continuous monitoring helps you understand what is actually happening inside your building.
With reliable data, you can:
Detect poor ventilation early
Identify recurring air quality problems
Understand when and where issues occur
Optimize ventilation and building operation
Investigate employee or occupant complaints
Document environmental conditions
Track improvements over time
Support health, safety, and facility management decisions
How it works
A complete monitoring solution
We do more than provide sensors.
Our solution covers the complete path from measurement to actionable information.
Measurement
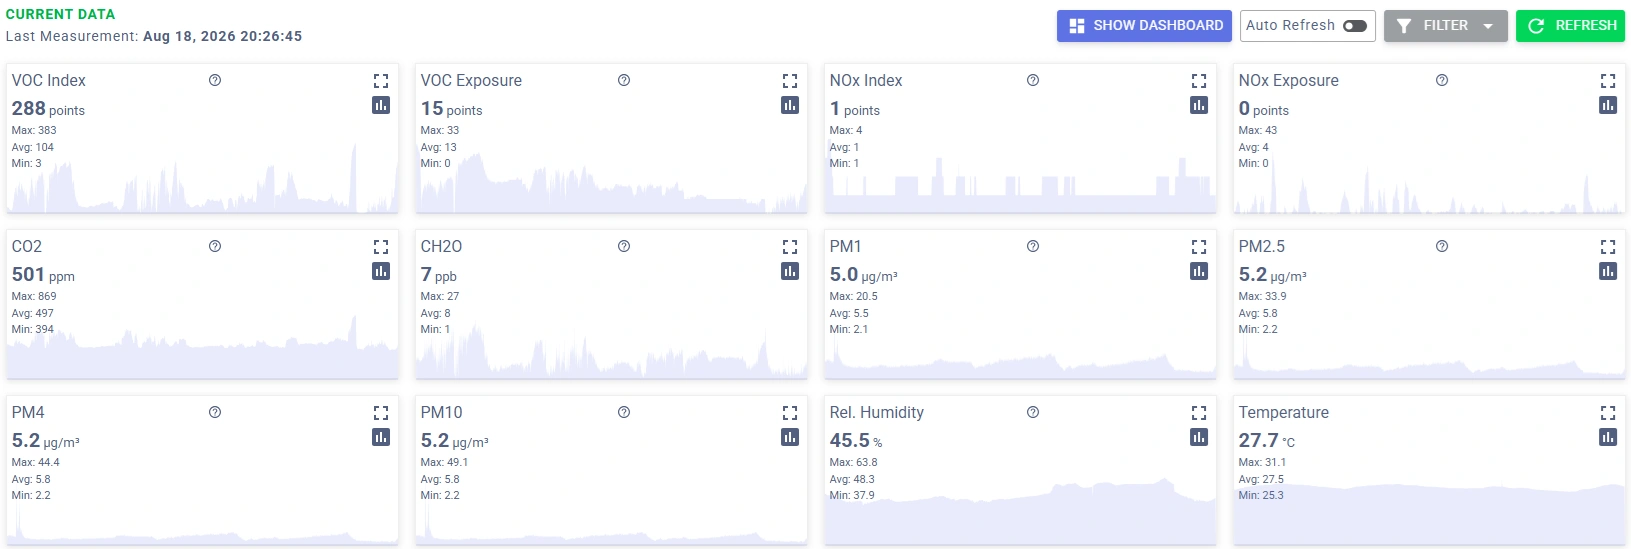
Connected monitoring devices continuously measure relevant environmental parameters in the areas that matter to you.
Depending on your requirements, measurements can include:
CO₂
Carbon monoxide (CO)
Ammonia (NH₃)
VOCs
Formaldehyde
NOx
Particulate matter (PM1, PM2.5, PM4, PM10)
Temperature
Relative humidity
Individual calibration certificates are available for selected sensors.
Secure connectivity
Measurement data is transmitted automatically through integrated connectivity.
Depending on the project, devices can use LTE or existing network infrastructure.
This means monitoring can be deployed without building a complex new IT infrastructure around each measurement point.
LTE, WiFi or Ethernet
Encrypted communication
Secure remote updates
Centralized Data Platform
All measurement data is collected in one central platform, deployed either:
On our Swiss based cloud infrastructure, or
On premises within your own IT environment
This gives you full visibility across individual rooms, production areas, buildings, or multiple sites while keeping deployment aligned with your security and data hosting requirements.
You can access:
Current environmental conditions
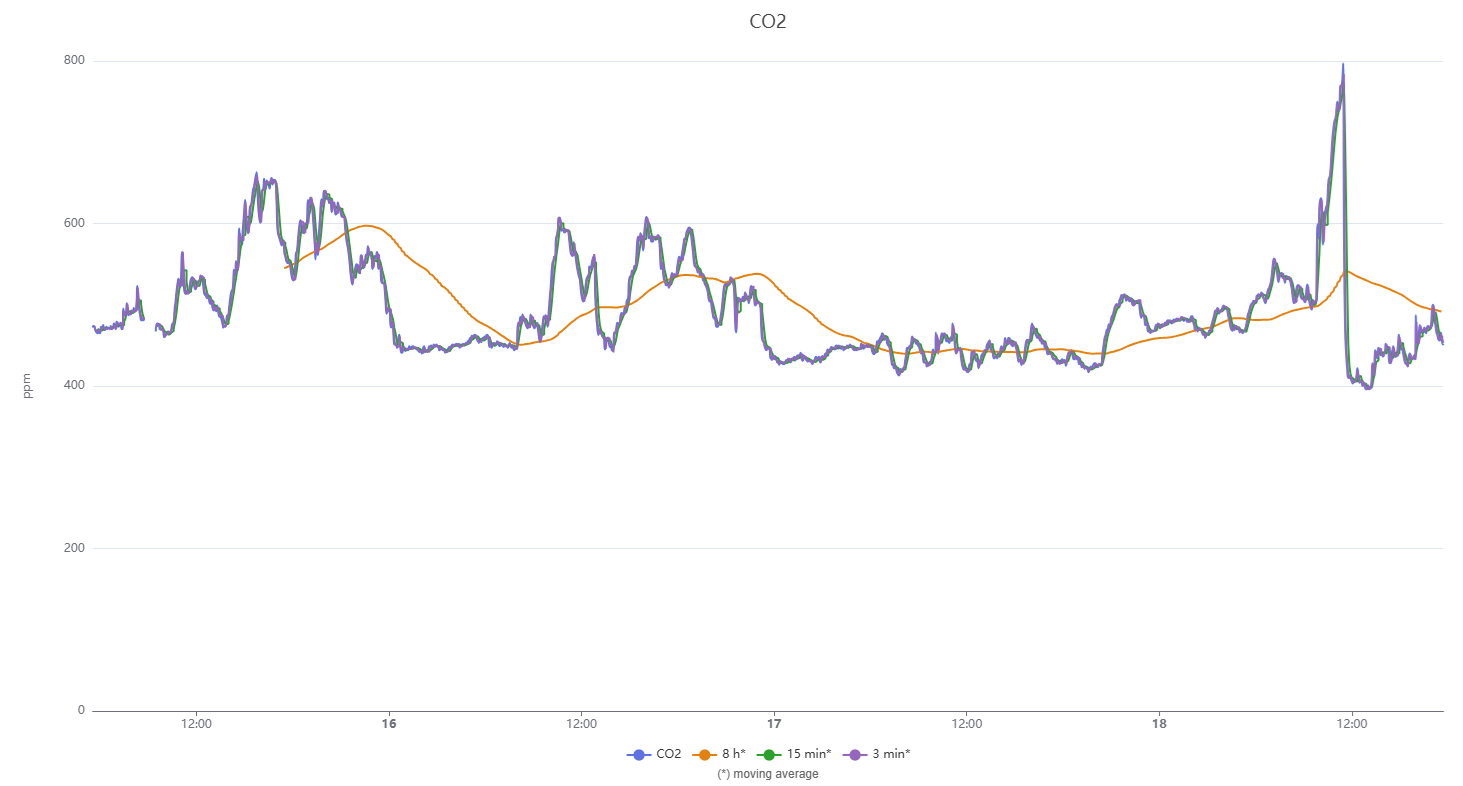
Historical trends and long term developments
Multiple rooms, zones, or locations
Threshold violations and alerts
Comparisons between measurement points
Centralized reporting and data export
Choose the deployment model that best fits your organization, whether you prefer a managed Swiss cloud solution or full control within your own infrastructure.
Alerts
Define thresholds for the parameters that matter to your environment.
When conditions move outside the desired range, responsible personnel can be notified so they can investigate and respond quickly.
Mobile app notifications
Email notifications
SMS notifications
Automated Action
Monitoring does not have to stop at alerts.
The platform can interact with connected building or automation systems to automatically improve air quality when predefined conditions are detected.
Depending on the installation, this can include:
Increasing ventilation when CO₂ levels rise
Activating extraction systems when VOCs or particles increase
Adjusting HVAC operation based on occupancy and air quality
Triggering fans, dampers, or filtration systems
Sending commands to PLCs, building management systems, or other automation platforms
Combining air quality thresholds with schedules or process conditions
This enables a closed loop approach where the system can not only detect poor air quality, but also respond automatically to improve conditions.
Reporting
Turn measurement data into usable documentation.
Automated, customizable reporting for:
Internal reviews
Facility management
Health and safety discussions
Investigations
Management reporting
Customer documentation
Before and after comparisons
Decisions, not graphs
From measurement to action
Collecting data is only useful if it helps you make better decisions.
Our solution helps answer practical questions such as:
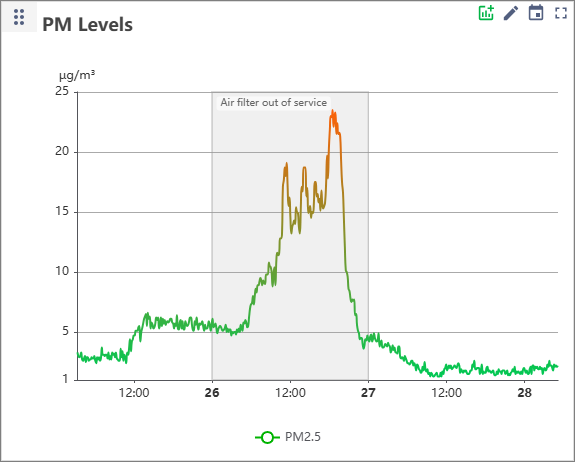
Are ventilation rates sufficient during occupied periods?
Which rooms regularly experience high CO₂ levels?
Are particles generated during certain production processes?
Do VOC levels increase during cleaning or maintenance activities?
Does air quality improve after ventilation changes?
Are complaints linked to measurable environmental conditions?
Which areas require further investigation?
The objective is not simply to generate graphs.
It is to help you understand the environment and decide what to do next.
Where it is used
Typical applications

Offices
Understand ventilation performance and indoor comfort across meeting rooms, open offices, and shared spaces.

Schools and educational facilities
Monitor CO₂ and environmental conditions in classrooms to support better ventilation and healthier learning environments.

Workshops and garages
Detect changes caused by exhaust gases, particles, chemicals, or insufficient ventilation.

Production environments
Monitor air quality around manufacturing processes where dust, VOCs, combustion products, or other pollutants may be present.

Paint shops and surface treatment areas
Track VOCs and particulate matter to better understand exposure and ventilation performance.

Woodworking environments
Monitor particulate matter generated by cutting, sanding, and processing operations.

Commercial kitchens
Understand how cooking processes affect particles, gases, temperature, and ventilation requirements.

Indoor Events
Monitor air quality indicators during high occupancy events (concerts, conferences) to help maintain comfortable and healthy indoor conditions.
Measurement strategy
Monitoring tailored to your environment
Every building and every process is different.
We help determine:
What should be measured
Where sensors should be placed
How many monitoring points are required
Which thresholds make sense
How data should be visualized
Who should receive alerts
How reports should be structured
This avoids deploying sensors without a clear monitoring strategy.
Measurement hardware
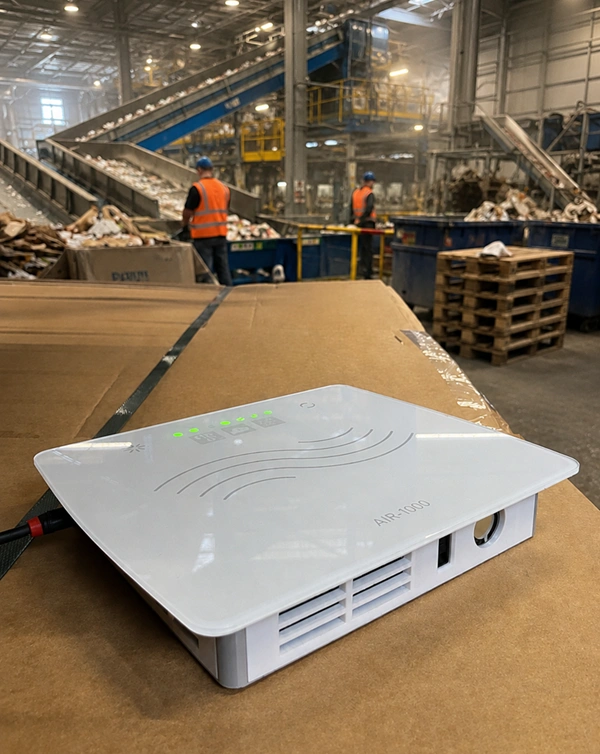
The AIR-1000 monitoring device
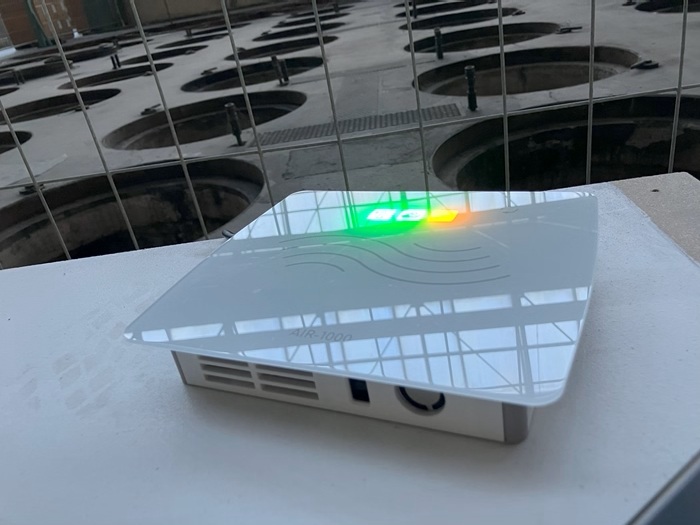
The AIR-1000 is one of the measurement devices used within our IoT Air Quality Monitoring solution.
It combines multiple air quality sensors, integrated connectivity, and secure data transmission in a compact device designed for professional environments.
Depending on the application, AIR-1000 devices can be deployed across individual rooms, production areas, buildings, or multiple sites.
The device is supplied and configured as part of the complete monitoring solution rather than as a standalone measurement product.
Scope
What is included
A typical IoT Air Quality Monitoring solution can include:
Initial requirements assessment
Selection of relevant measurement parameters
Sensor placement planning
AIR-1000 monitoring devices
Connectivity configuration
Cloud platform access
Dashboard setup
Mobile app
Alert configuration
Historical data storage
PDF reporting
User access management
Commissioning
Training
Ongoing support
The platform
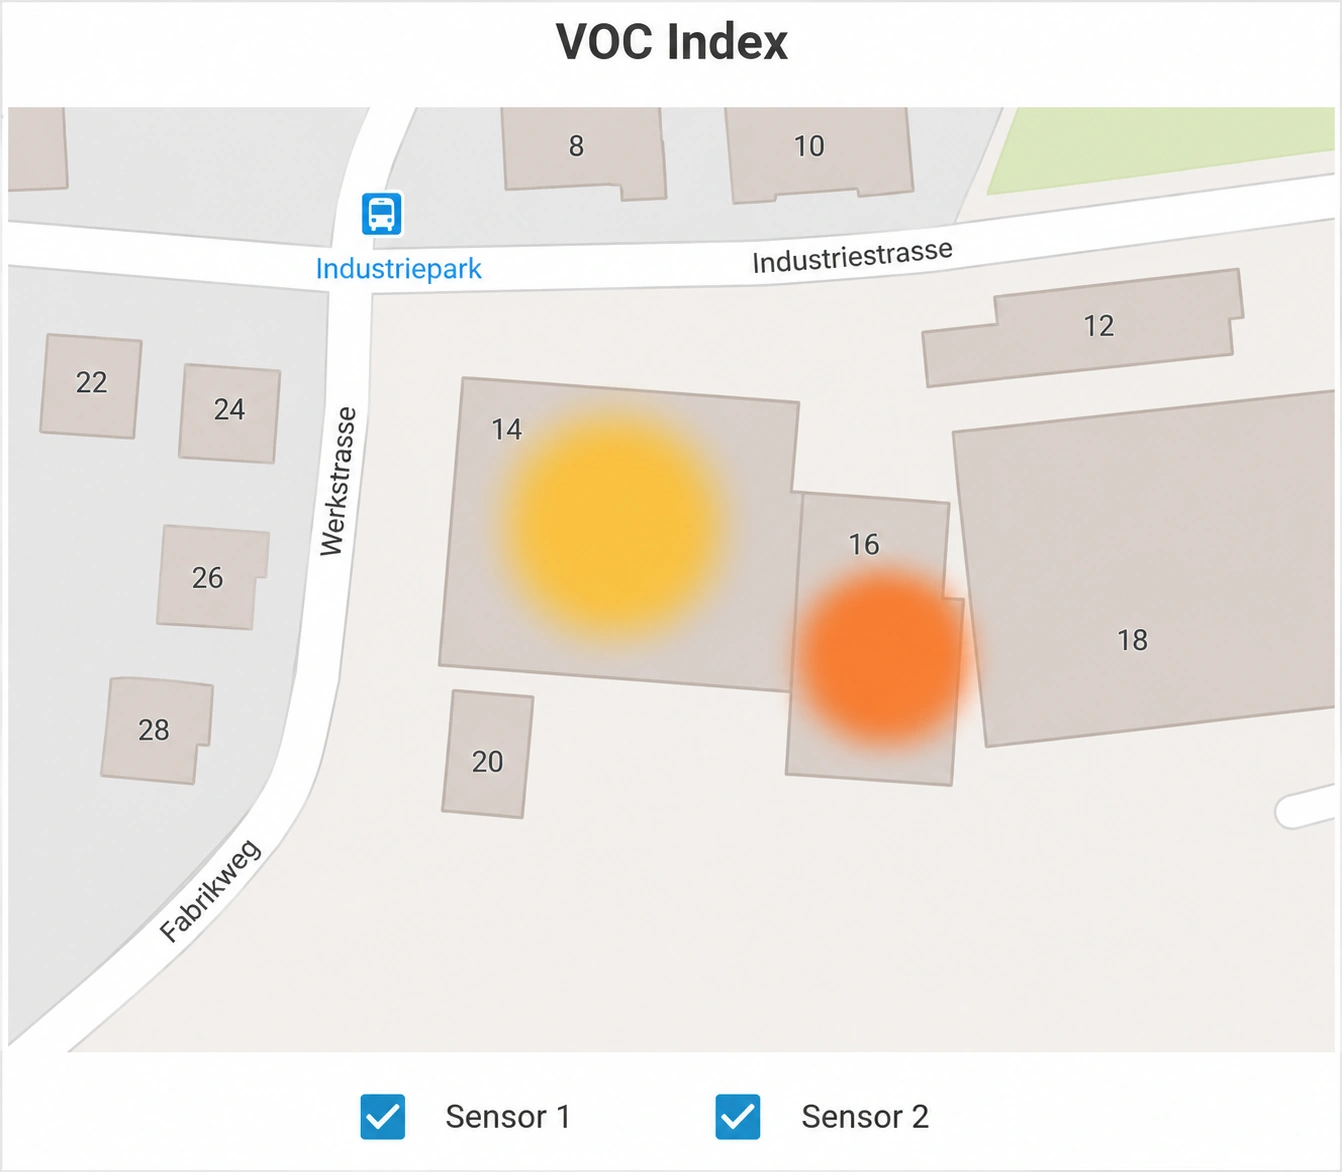
Dashboard and data access
Real-time overview
See the current condition of each monitored area at a glance.
Historical trends
Understand how air quality changes throughout the day, week, or season.
Custom dashboards
Create views around the parameters and locations that matter most to your organization.
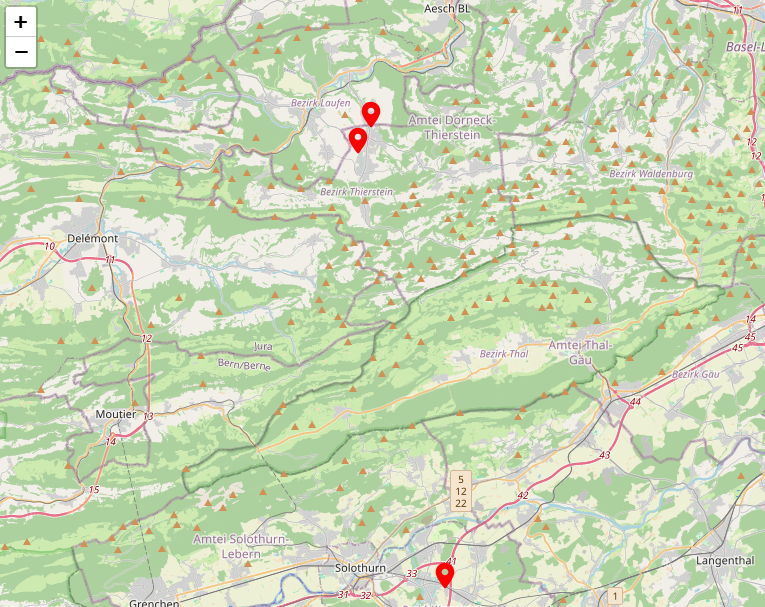
Multiple locations
Monitor several rooms, buildings, or sites from one interface.
Data export
Export measurements for deeper analysis or integration into existing reporting processes.
PDF reports
Create clear reports for internal documentation, management, audits, or investigations.
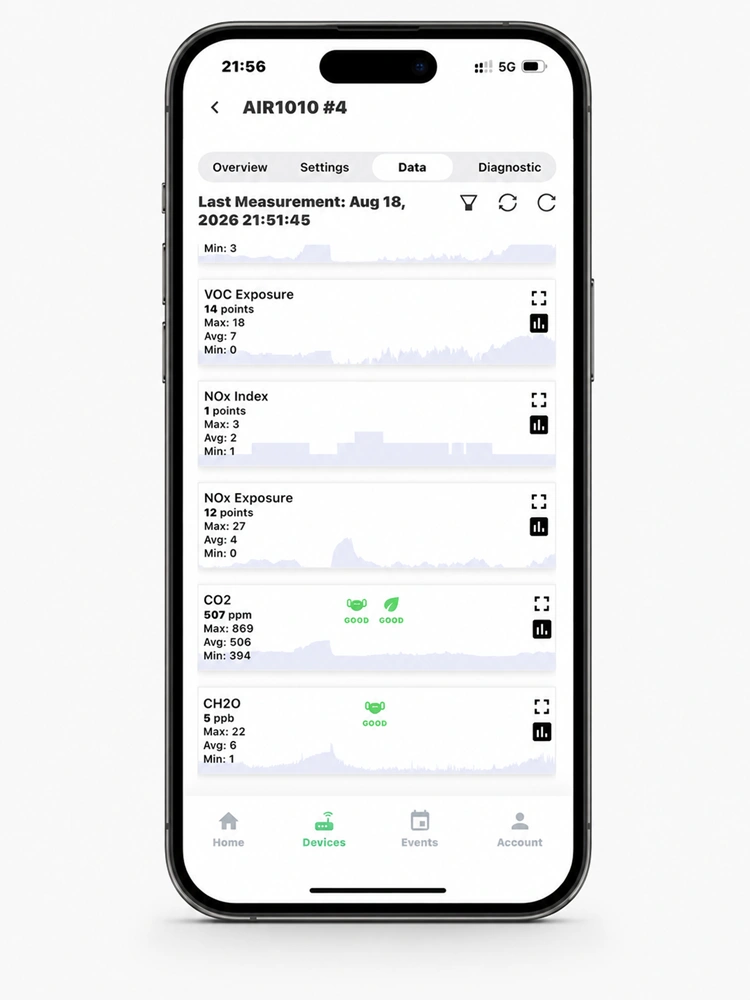
Mobile access
Check current conditions and alerts without being tied to a workstation.
Notifications
Alerts that support action
A threshold alarm should help someone make a decision, not simply generate another notification.
We configure alerts based on your environment and operational requirements.
Examples include:
Elevated CO₂ indicating insufficient ventilation
Increased particulate matter during production
Abnormal VOC concentrations
Temperature or humidity outside the desired range
Persistent problems in a specific room
Sudden changes that may require investigation
Temporary deployments
Short-term monitoring and investigations
Not every application requires permanent monitoring.
For temporary problems, complaints, seasonal conditions, or specific investigations, we can also provide short-term monitoring deployments.
Typical applications include:
Investigating employee complaints
Evaluating ventilation performance
Comparing conditions before and after changes
Monitoring temporary workplaces
Assessing events or high-occupancy areas
Identifying the source of recurring air quality issues
After the monitoring period, the collected data can be reviewed and summarized in a report.
Scale
From one room to multiple sites
The solution can start small and expand over time.
Begin with a few critical areas and add additional monitoring points as requirements grow.
This makes the system suitable for:
Small workshops
Office buildings
Individual production areas
Schools
Multi-building facilities
Organizations operating across multiple sites
Why Kroemtech
One partner for the whole chain
One solution instead of separate components
Sensors, connectivity, dashboards, alerts, and reporting are designed to work together.
Focus on practical monitoring
We help define what is worth measuring and how the information can support real decisions.
Flexible deployment
Solutions can range from a temporary measurement project to permanent multi-site monitoring.
Professional data access
Your team gets access to historical data, dashboards, reports, and alerts without needing to build its own IoT infrastructure.
Secure by design
Connectivity and data handling are implemented with security in mind, including encrypted communication and controlled user access.
Start with your environment, not with the sensor
The right air quality monitoring solution depends on the building, the activities taking place inside it, and the questions you want the data to answer.
Tell us what you want to understand or improve.
We will help define the measurement strategy, deploy the monitoring system, and turn the collected data into useful information.